✨ AI-Powered Visualization
Intelligent Charts That Generate Themselves
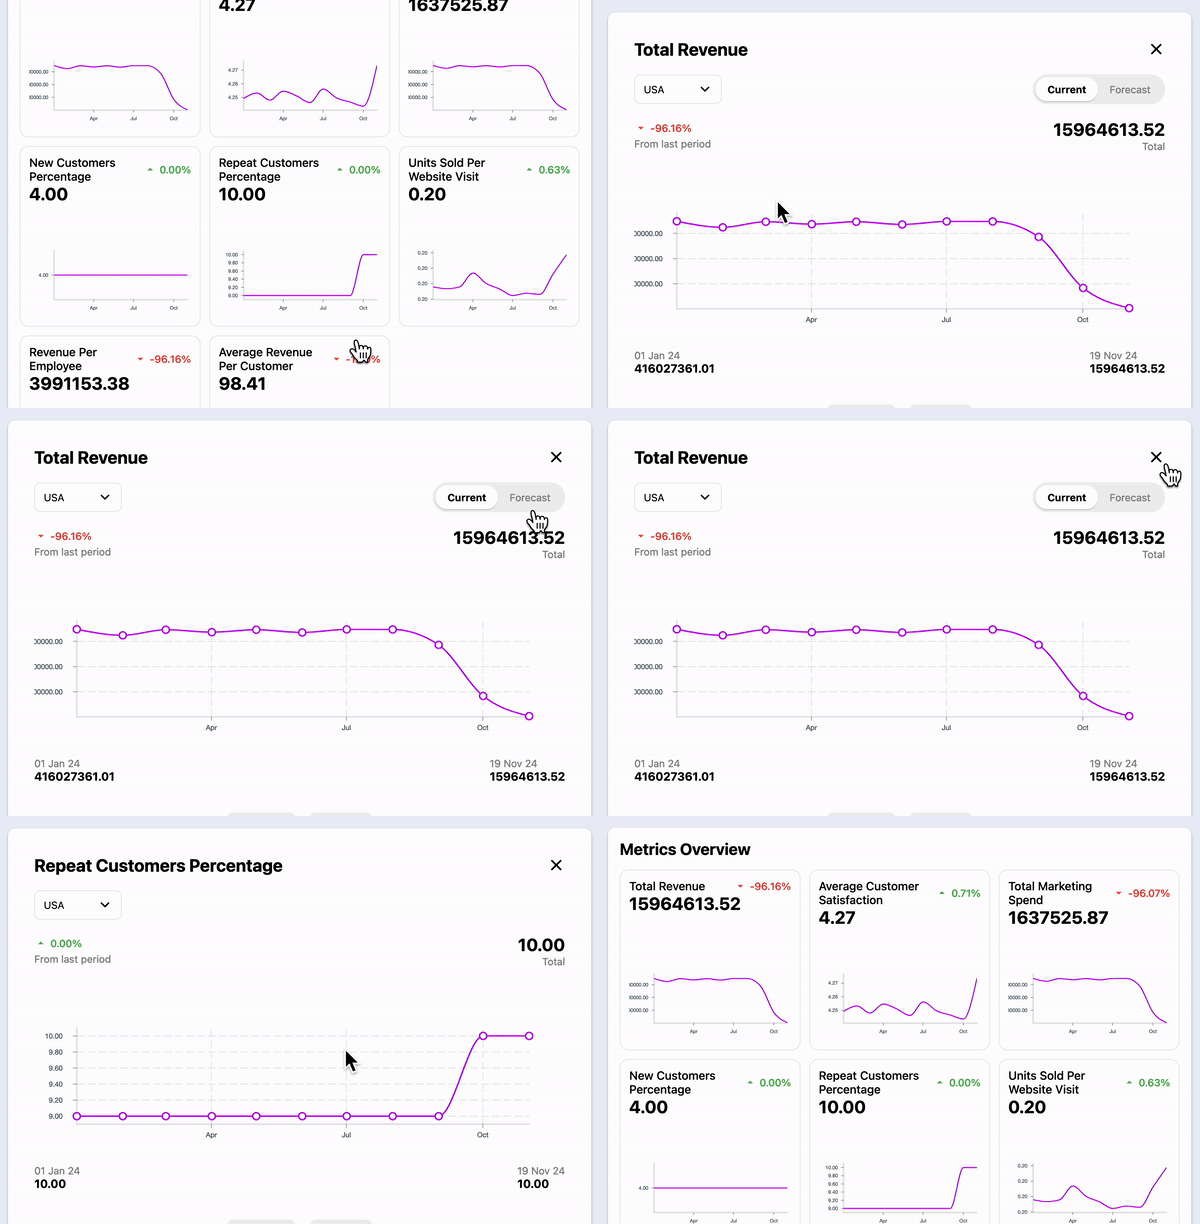
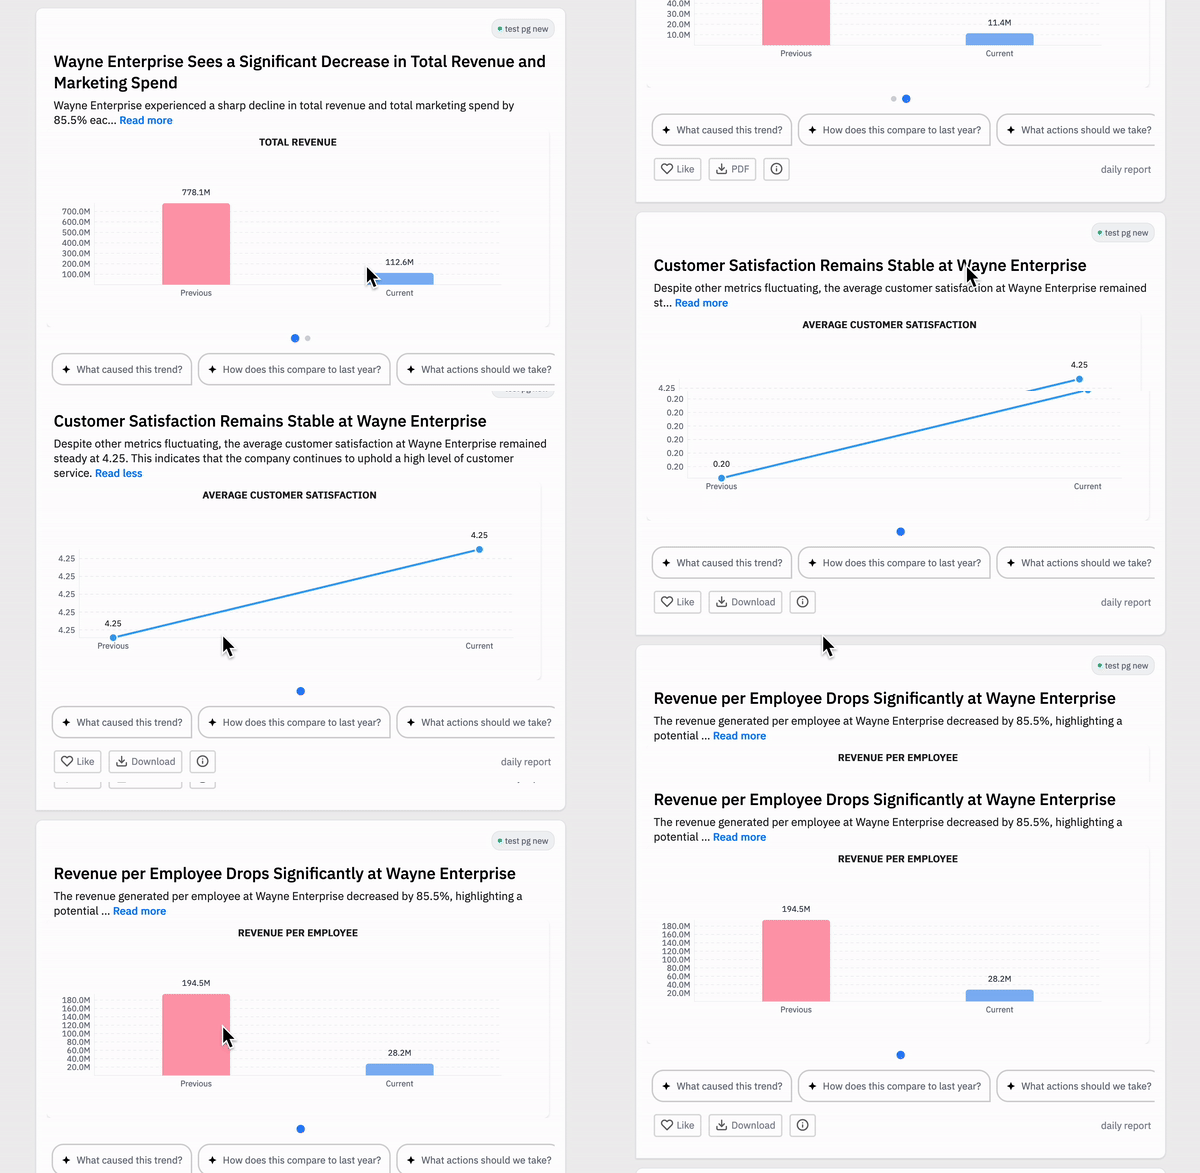
Transform your data into stunning visualizations automatically. Our AI selects the perfect chart types and creates insightful dashboards without any manual effort.
Get Started
Auto-Generated Visuals
AI automatically chooses the best visualization type for your data, creating clear and impactful charts instantly.
Real-Time Updates
Charts update automatically as your data changes, ensuring you always see the latest insights.
Interactive Dashboards
Explore your data through dynamic, interactive visualizations that respond to your queries.
Intelligent Chart Selection
Let AI choose the perfect visualization for your data.
- Automatic chart type selection based on data patterns
- Smart color schemes and styling
- Responsive design that works on all devices
- Accessibility-first approach to visualization

Dynamic Data Integration
Connect multiple data sources for comprehensive visualizations.
- Real-time data synchronization
- Automated data cleaning and preparation
- Multiple data source integration
- Automatic outlier detection and handling

Predictive Visualizations
See into the future with AI-powered forecasting charts.
- Trend prediction and visualization
- Confidence interval displays
- Seasonal pattern detection
- What-if scenario modeling

Interactive Exploration
Dive deep into your data through interactive features.
- Drill-down capabilities
- Custom filtering options
- Dynamic date range selection
- Cross-chart interactions
