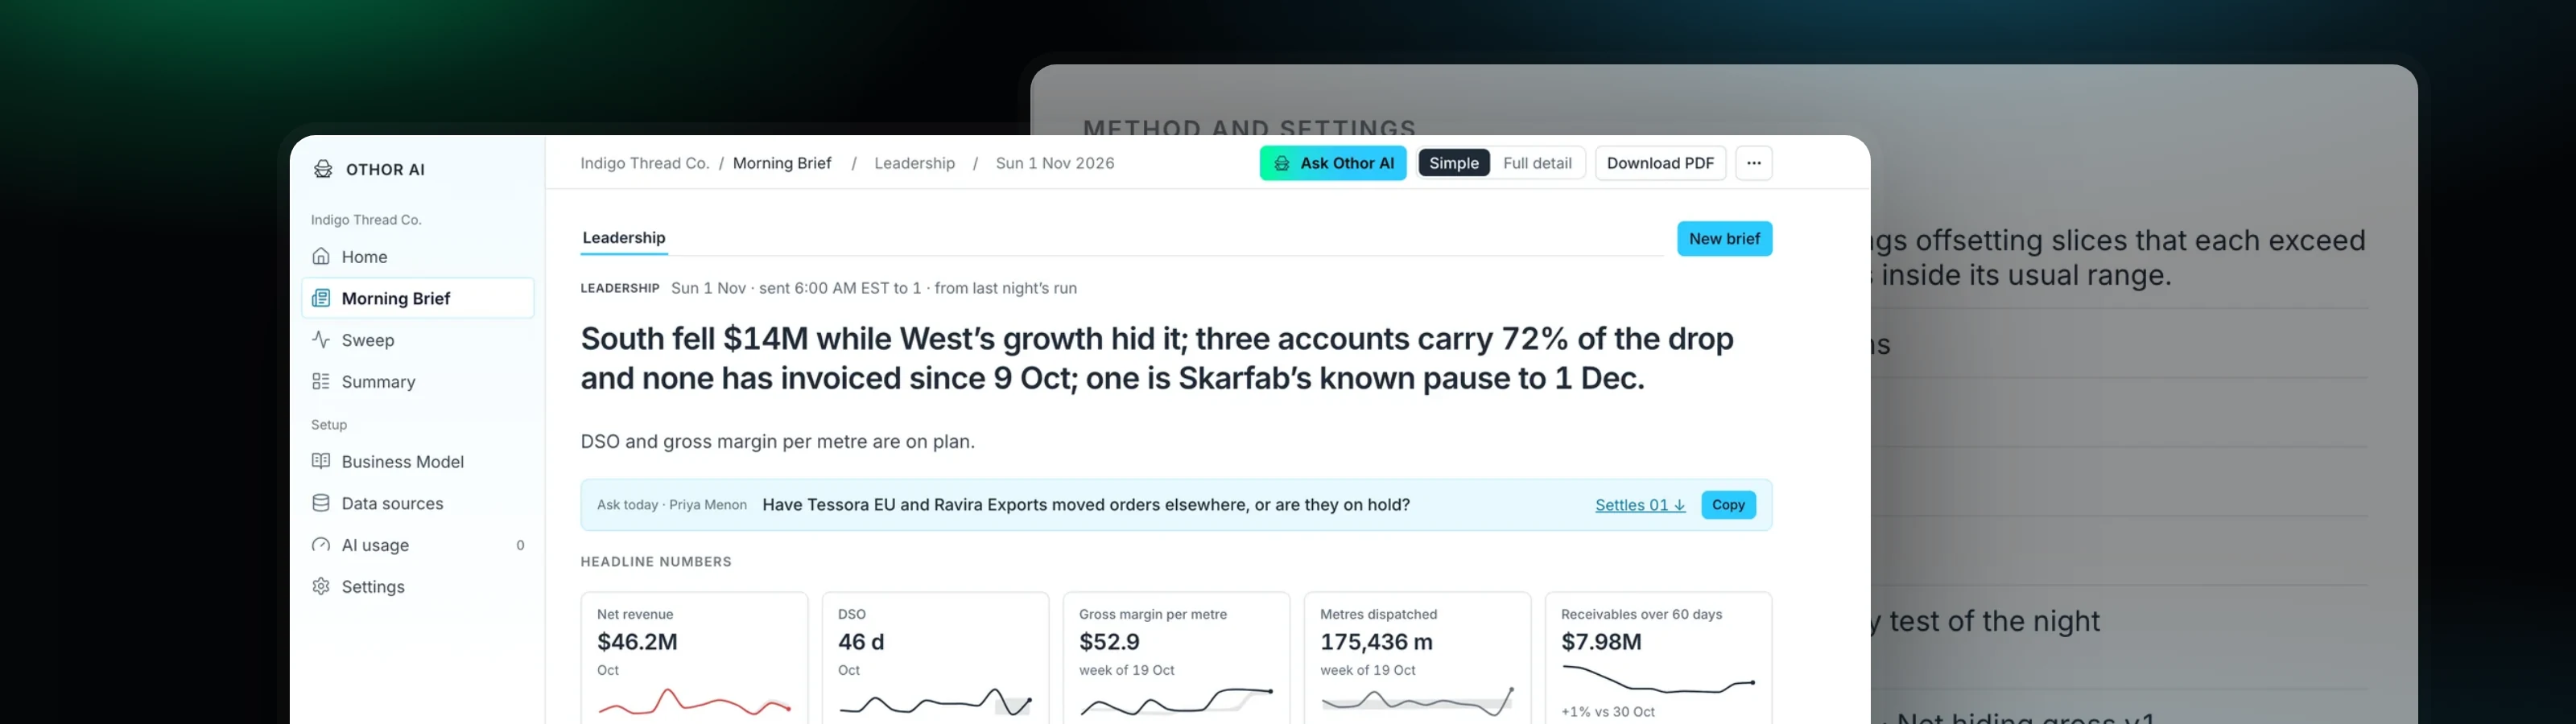
The design of Othor AI Bifrost: a Head of Intelligence for the head of a business.
Abstract. Business intelligence spends one of two scarce resources and still sees only part of a business. Dashboards spend human effort and show what someone thought to ask. Language-model agents spend tokens, which grow with every row, user and question, and they can produce a number nobody computed. We describe Othor AI, an open-source analytics engine that takes a third path: a compiled specification of the business, an exhaustive nightly battery of statistical tests, and a language model confined to drafting setup and phrasing. Every night it materialises every metric and every breakdown, runs eleven detectors drawn from classical signal analysis, corrects all p-values together for false discoveries, grades each surviving result in the manner of intelligence analysis (Measured, Assessed, Not determinable), ranks findings by money at stake, and delivers a Morning Brief at 06:00. The run is deterministic and replayable byte for byte; every figure carries its definition, SQL, test, parameters and run. On a synthetic company of about 205,000 rows and 29 metrics, setup costs about $0.61 in model tokens once; a nightly run performs 294 hypothesis tests and 154 SQL queries with zero model calls in 28 seconds; and its replay reproduces the night's outputs byte for byte in 15.8 seconds. We describe the design, the methods, the guarantees and the limits, and we explain why we released the core as open source.
01Introduction
Every morning, the head of a state reads a brief that an intelligence service worked through the night to prepare. It is short. It does not show everything that was collected; it shows what changed, how confident the analysts are, and what to ask next. Nobody expects a head of state to build that brief from charts.
The head of a business has never had one. They have dashboards, which answer the questions someone thought to ask when the dashboard was built, and a management report that arrives days or weeks after the period it describes, mostly in totals. The trouble in a business rarely sits in its totals. It sits underneath them: a region falling while another's growth covers it; a handful of customers carrying most of the revenue; a customer still marked active who stopped ordering a month ago; two systems that disagree on the same figure; one number that started moving weeks before another.
Three things make these hard to see:
- Combinatorics. A modest company with 30 metrics and a few breakdowns (region, plant, product family, customer) has thousands of series. No analyst inspects them all, every week.
- Chance. Inspect enough series and some will look remarkable by accident. Without a correction for multiple testing, a system that looks everywhere drowns its reader in false alarms.
- Trust. A finding is only useful if the reader believes the number and knows how sure to be. A number that cannot be traced, or that changes when the question is asked twice, is worse than no number.
The recent wave of language-model analytics addresses the first problem by spending tokens: a model plans queries, reads results and writes answers. It does not address the second, and it makes the third harder. Model output is not deterministic, the bill scales with data and usage, and a fluent sentence can carry a number that no query produced.
Othor AI is built on the opposite premise. AI has made charts and reports a commodity. What remains scarce is knowing what to look at. We treat that as an engineering problem with three requirements: look at everything, every night; control for chance; and make every figure provable. We meet them with two disciplines that rarely meet business data: intelligence tradecraft, the way agencies collect, grade, connect and report signals, and signal analysis, a century of methods for separating signal from noise, detecting change hidden in an average, and finding relationships that lead and lag.
This paper describes the result: a self-hostable engine that runs as a deterministic nightly batch and emits a ranked, provenance-linked brief. We call the role it plays a Head of Intelligence.
02The design problem: what do you spend?
Every approach to business intelligence spends something.
| Approach | Compute and tokens | Human effort | Coverage | Reproducibility |
|---|---|---|---|---|
| Dashboards and analysts: people author queries and read charts | Low | High: every question is hand-built | Only what someone thought to ask | High |
| LLM-first agents: a model plans queries and writes the answer | High, scaling with data and questions | Lower | Wide but uneven | Low: ask twice, get two answers; numbers can be generated |
| Othor AI: a compiled specification, exhaustive tests, a model only for prose | Near zero at run time | Minimal | Every metric × every breakdown, every night | Byte for byte |
The third row is not a compromise between the first two. It changes what each resource is spent on. Human effort goes into confirming what the business's numbers mean, once, at setup. Model tokens go into drafting that setup and smoothing sentences. Everything that produces a number is code.
This is also why the AI bill is small and stays small. In an agent design, cost scales with rows, users and questions. In ours, the model never sees rows, the nightly run calls no model, and the only recurring model use is the optional rewrite of a brief's sentences, about one cent per brief. The bill does not grow with your data.
03Principles
Eight rules govern the codebase. Each is enforced by code or by CI, not by policy.
- AI drafts, code computes. No number shown to a user, emailed, stored as a result or used in ranking comes from a model. A model's output that contains a number is discarded or replaced from the computed value.
- Same inputs, same numbers. The nightly run is deterministic: pinned libraries, seeded routines, an append-only run ledger.
othor replay <run_id>reproduces a run byte for byte. CI fails if it doesn't. - Read-only, in place. Sources are read through read-only credentials; a role that can write is refused. No raw rows go to a model. Personal columns are never read: not in queries, samples or prompts.
- The nightly run needs no model. If the provider is down, the run, the detectors, the forecasts and the brief's numbers still work; prose falls back to templates.
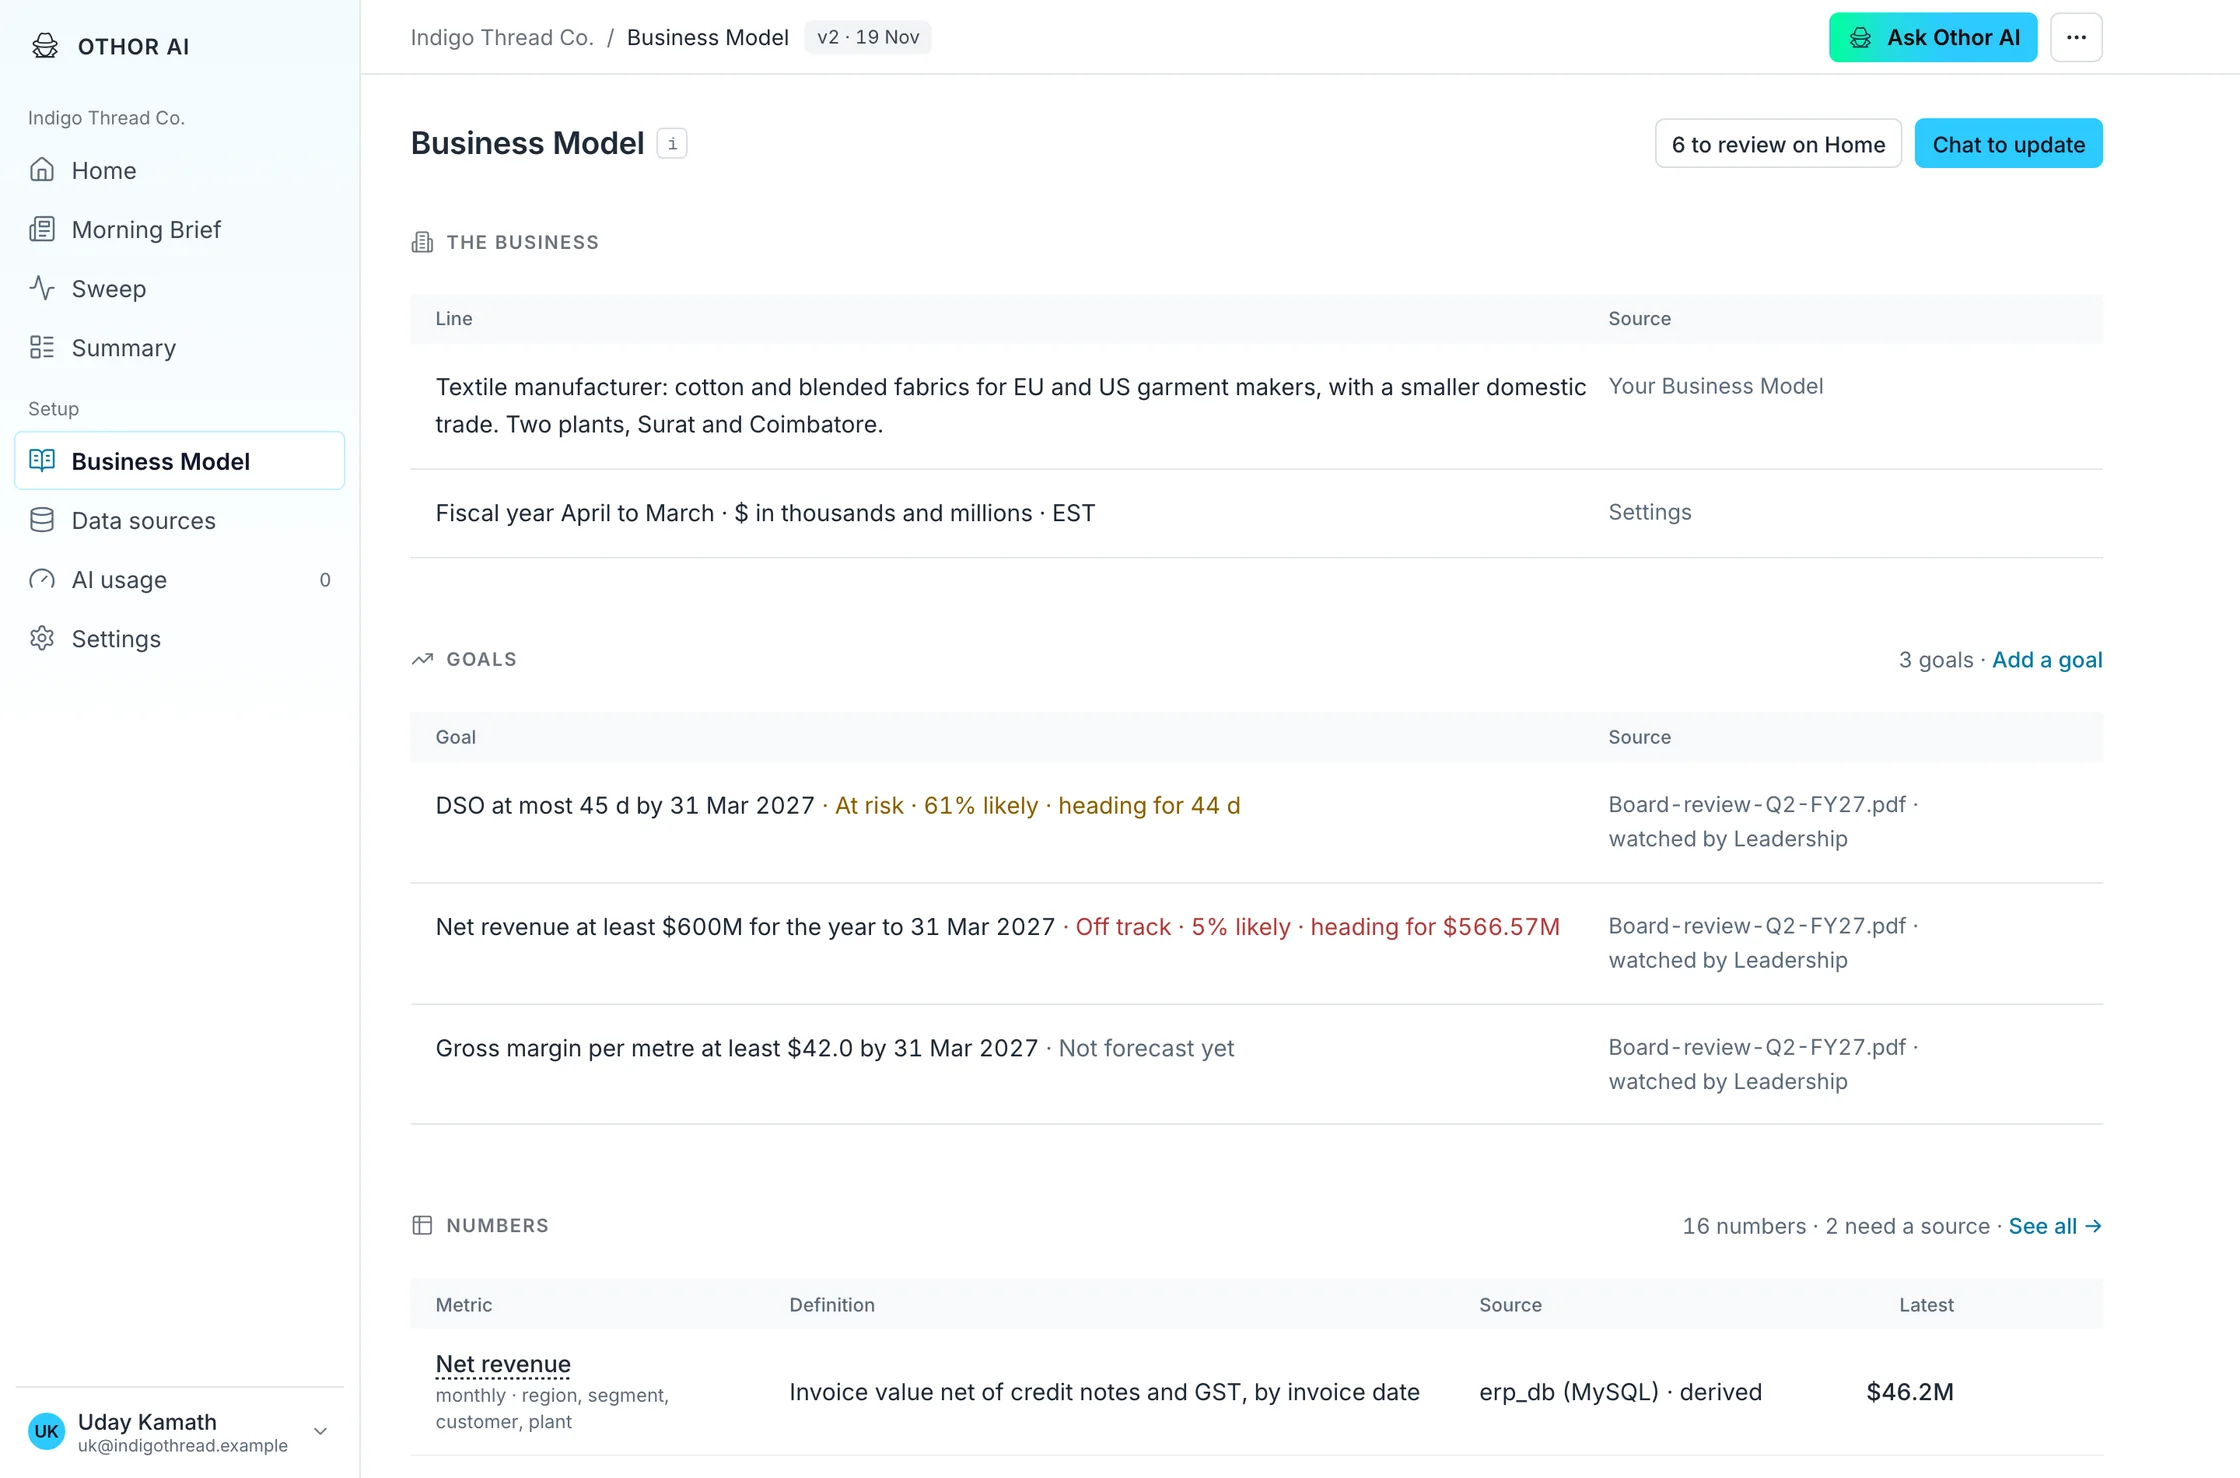
- Every figure has provenance: its definition, SQL, test, parameters, specification version and run.
- Nothing AI drafts goes live until a person applies it.
- Runs where the data lives. One container image, configured by environment and a data directory; nothing depends on a service only we could host.
- Small bills. Minimal tokens, incremental reads, results stored rather than tables copied.
We describe these as built like a chip, not a chatbot. A chip is designed to a power budget, gives the same output for the same input, and passes the test bench before it ships. The analogy is literal in the engineering: the expensive component (a model) is used only where nothing cheaper will do; the system is a pure function of its inputs; and its behaviour is pinned by golden tests.
04Architecture
sources (PostgreSQL · MySQL · Google Sheets; read-only, incremental)
   │
   ▼
Business Model (typed, versioned records) ──compile──▶ spec (SQL + rules, hashed)
   │
   ▼  nightly: in-process scheduler + idempotent job table
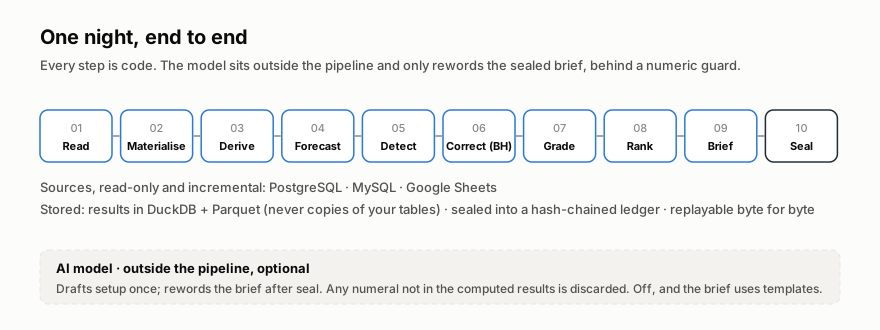
materialise → derive → probes → forecast → detect (BH-FDR) → grade → rank → brief → seal (ledger)
   │                                                                              │
   ▼                                                                              ▼
DuckDB + Parquet on the data volume (results, not copies)     Morning Brief: web · email · PDF
4.1 The Business Model and the compiler. What a business's numbers mean is not in its database. "Net revenue" may exclude GST in the ERP and include it in the board's spreadsheet; one plant may record dispatch in metres and another in yards; credit notes may arrive weeks late. Othor AI keeps this knowledge as a Business Model (in data terms, an ontology): typed, versioned records of metrics, breakdowns, filters, joins, books of record, currency and unit rules, goals, known patterns and owners. A model may draft these records at setup from schema statistics and the owner's documents; a person applies them; nothing goes live until then.
A compiler turns the active Business Model into an immutable, hashed specification: for each metric, a measure, filters, grain, breakdowns, joins and rules, rendered as SQL per dialect with a query builder, never by concatenating text. The compiler refuses any metric whose expression, filter or join touches a column classified as personal. A series is a metric × a breakdown value × a grain; breakdown cardinality is capped (top 50 values by default, the rest as "Other"), and the cap is recorded in the spec.
Each metric carries two hashes. The definition hash captures meaning: measure, filters, rules, units. Only a change to it starts a new series version, and the old points are archived, never mixed. The render hash captures the compiled SQL; a compiler fix changes it without restarting history. This distinction lets the system evolve without corrupting its own baselines.
4.2 Reading. Reads are incremental by watermark (an updated_at column, or an invoice date for append-only tables) with a look-back window to catch late credit notes. Each night's series values and evidence aggregates are stored in DuckDB, with a Parquet snapshot per run for replay. A source that cannot be read marks its series stale with the last good date; dependent findings are skipped and listed as "could not run" rather than computed from old data.
4.3 The nightly pipeline. Materialise, derive, probe, forecast, detect, grade, rank, assemble the brief, seal. Every step is a job in an idempotent table; a failed night resumes. The seal step writes the run to the ledger (§7).
4.4 Stack. Python 3.12; FastAPI, Jinja2 and htmx, server-rendered with no single-page app; SQLAlchemy 2 and Alembic (PostgreSQL in the cloud, a SQLite-compatible schema for on-premise); DuckDB and Parquet; pandas, NumPy, SciPy, statsmodels and ruptures; charts as a ChartSpec rendered to SVG and PNG on the server. One image.
05Detection: eleven detectors
Each night every series and breakdown goes through eleven detectors. Each is a pure function from a materialised frame to typed results carrying a statistic, a p-value (or a deterministic score mapped to one), an effect size, the money at stake, up to 50 evidence rows (aggregates only), SQL references and the entities involved. Each detector declares its minimum data; below it, the detector reports "could not run" with the reason, and never skips silently.
| # | Detector | What it finds | Method |
|---|---|---|---|
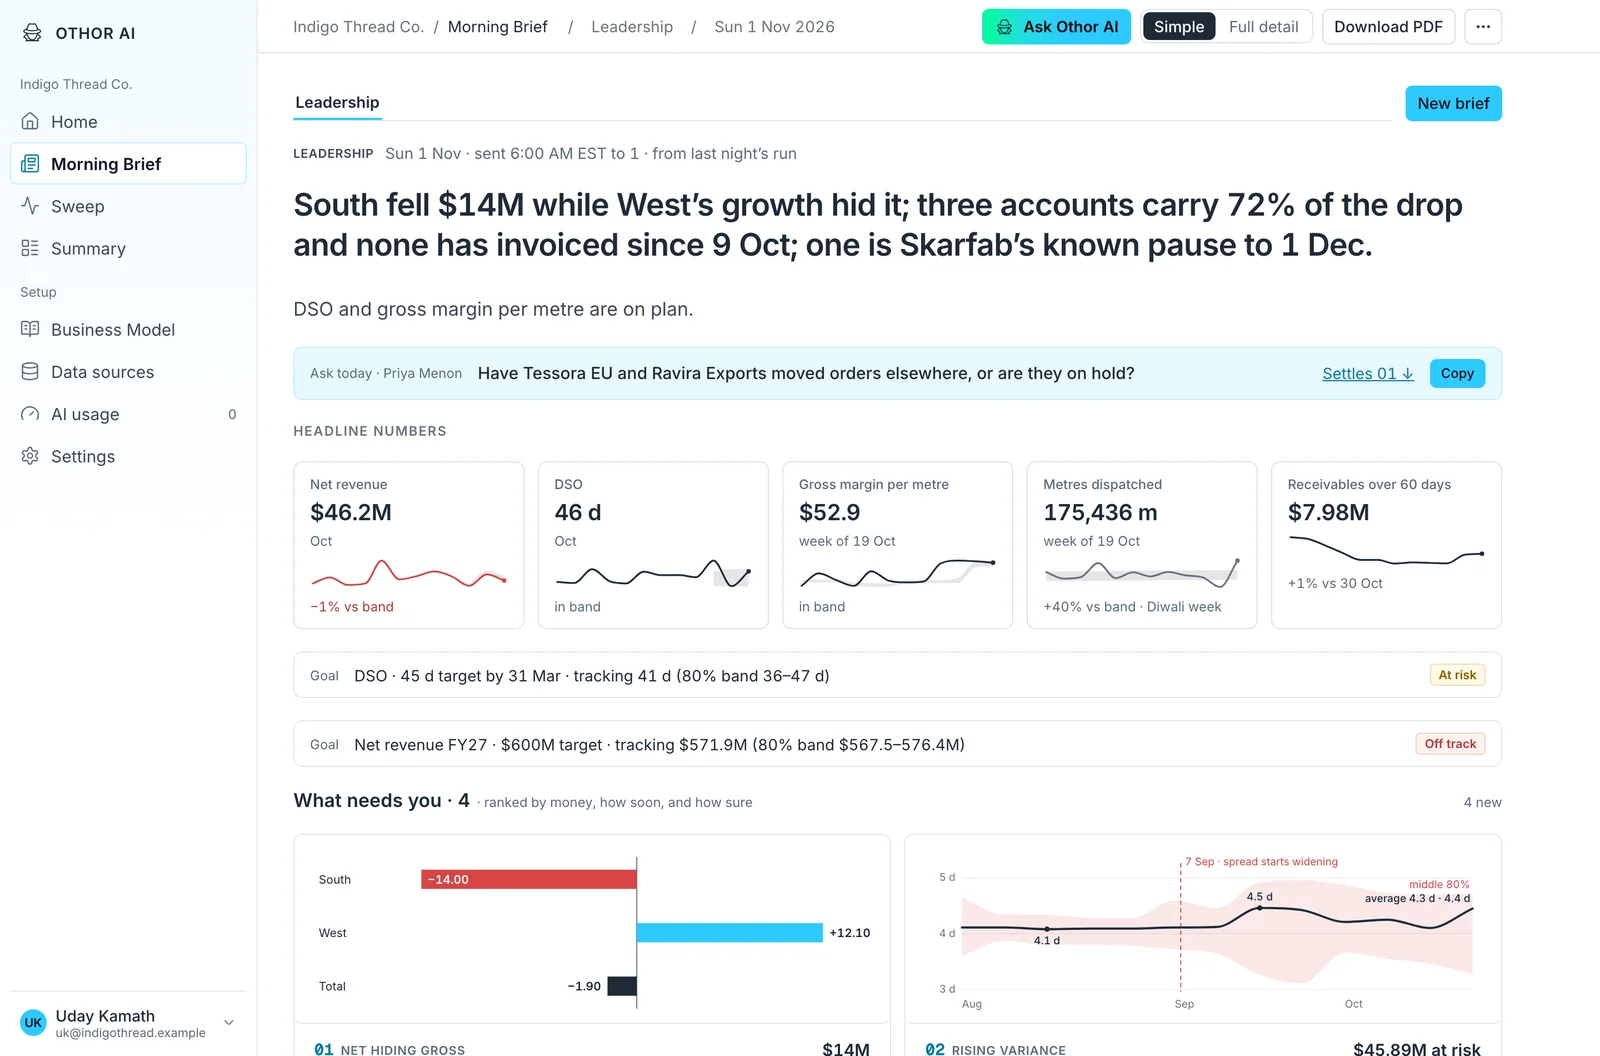
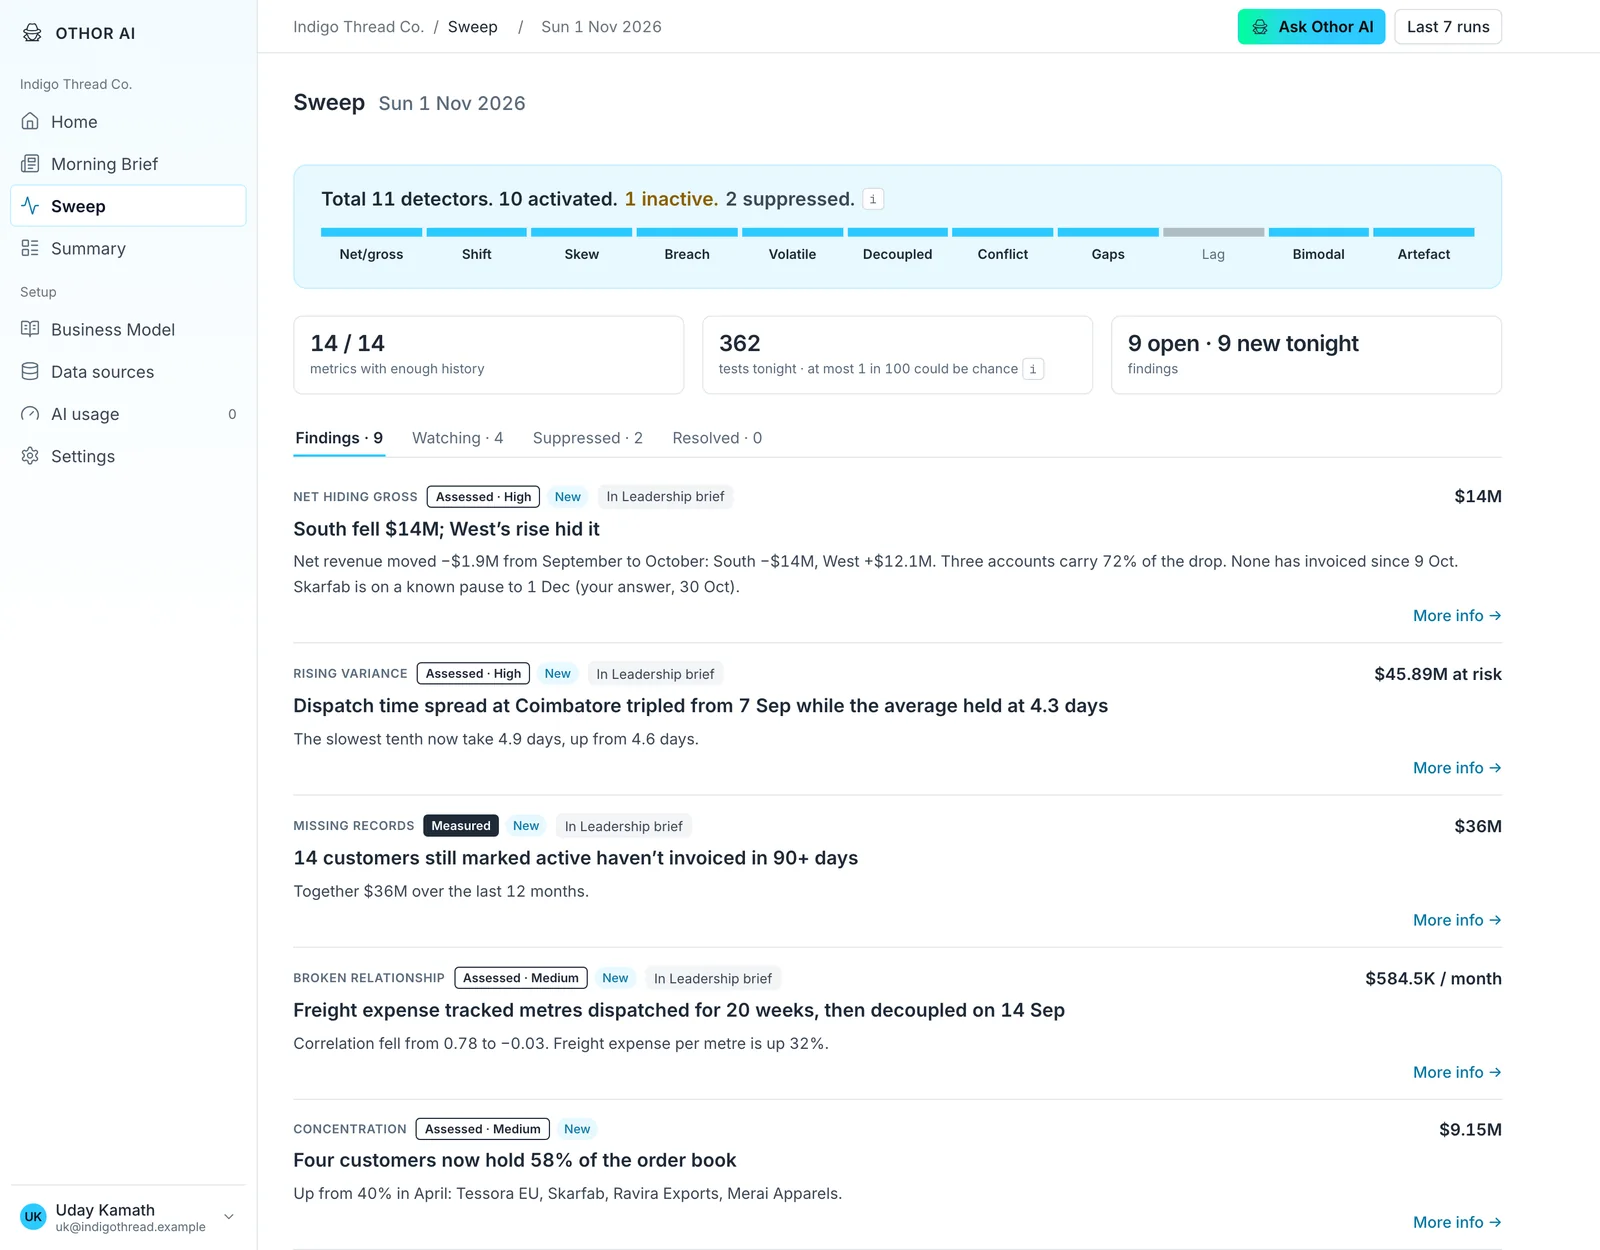
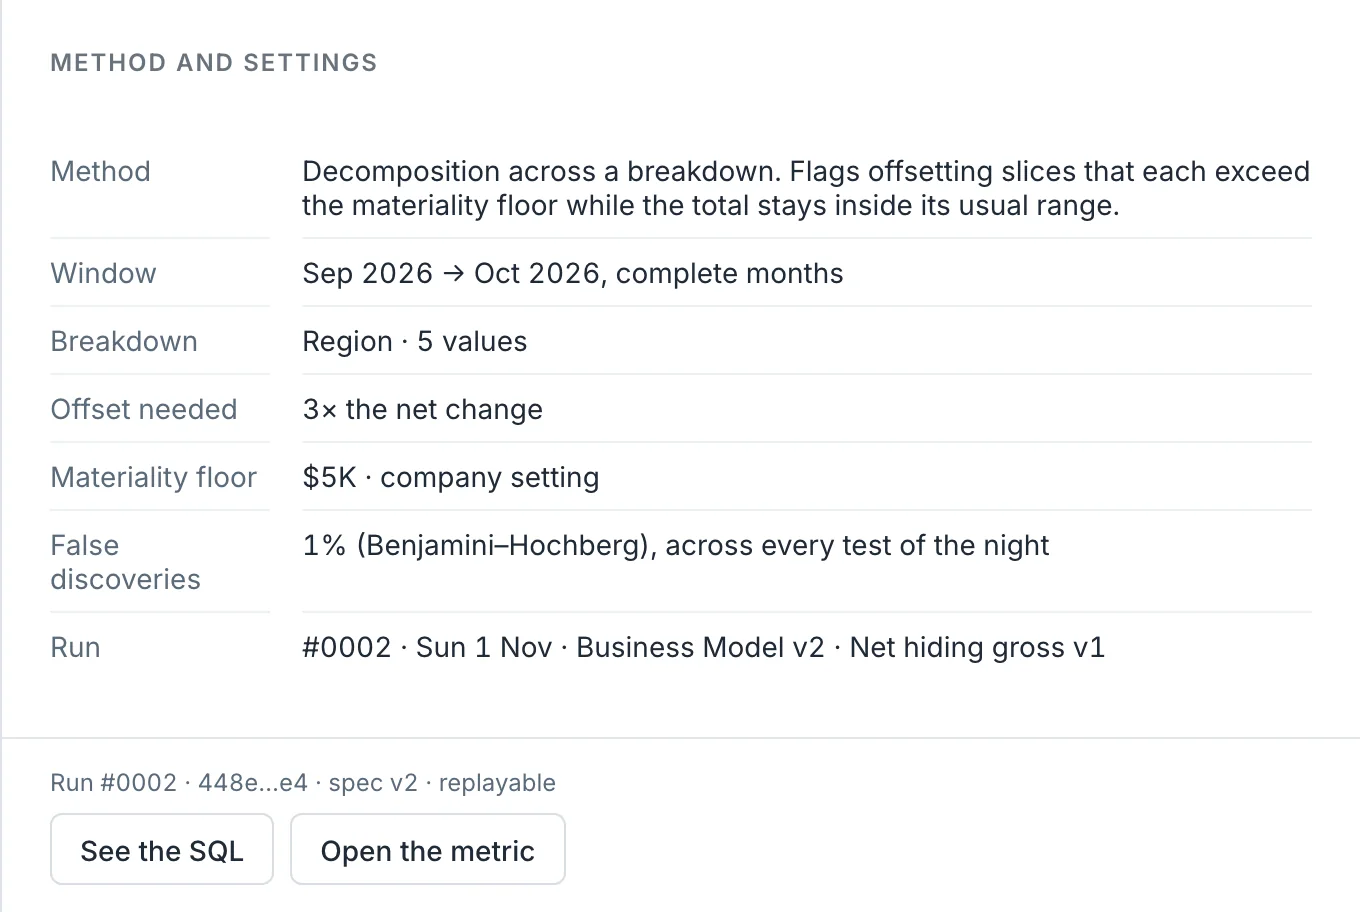
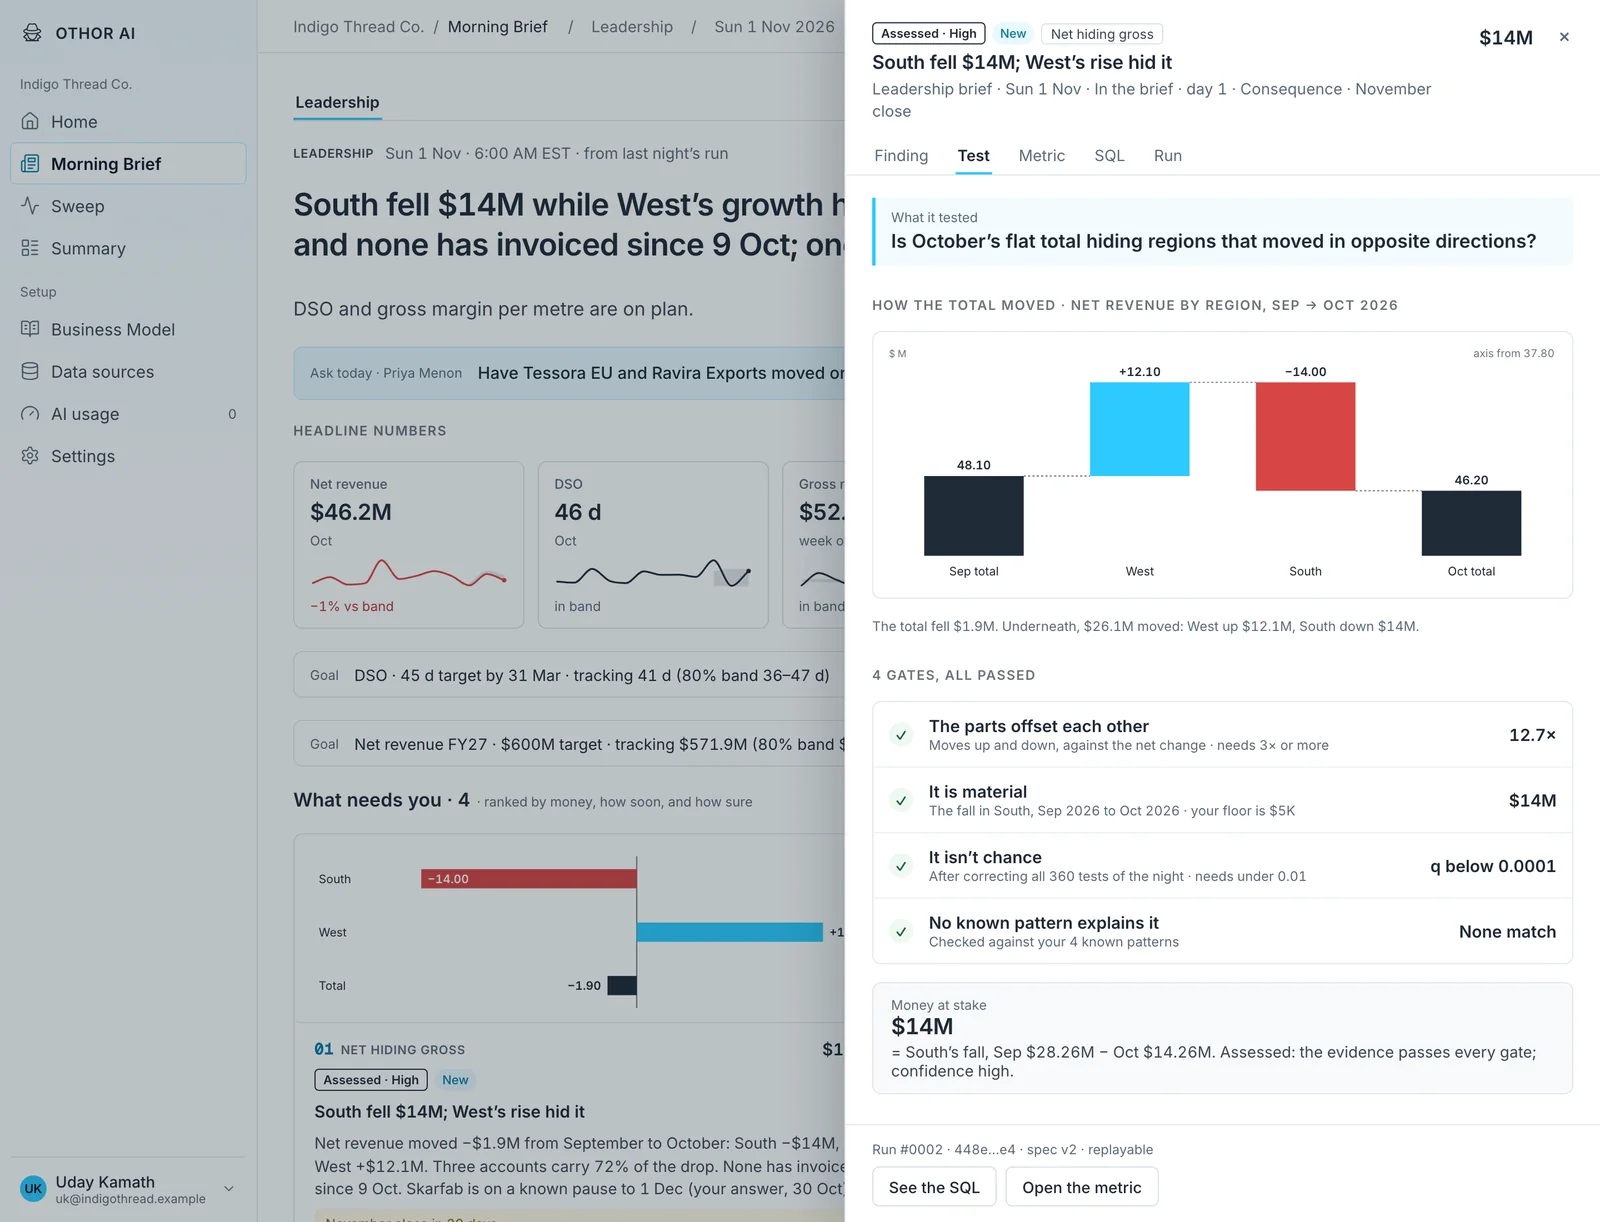
| 1 | Net hiding gross | A flat or rising total with offsetting moves underneath | Additive decomposition of the period change by breakdown; flags when gross offsets are at least three times the net change and the largest negative contributor exceeds materiality |
| 2 | Changepoint | The week a baseline moved | PELT (ruptures, L2 cost) on the weekly series, penalty scaled to the series' noise, confirmed by a two-sample test before and after |
| 3 | Forecast breach | An actual outside the band stated before it arrived | The closed period against the forecast of record, stored before the period began; never refitted |
| 4 | Rising variance | A spread widening while the level holds | Recent dispersion against the prior 12 weeks, F-test, Bonferroni over candidate start weeks; tested per process (each plant), not on their mix |
| 5 | Broken relationship | Two metrics that moved together, then decoupled | A predictive-failure (Chow) F-test on the relationship's fit before the candidate break |
| 6 | Lead–lag | One metric moving weeks before another | Lagged Spearman correlation over lags of 1–8 weeks; the best lag's significance from a seeded permutation test |
| 7 | Concentration | A few names carrying most of the value | Herfindahl index and top-N share per period, with a trend test on the share |
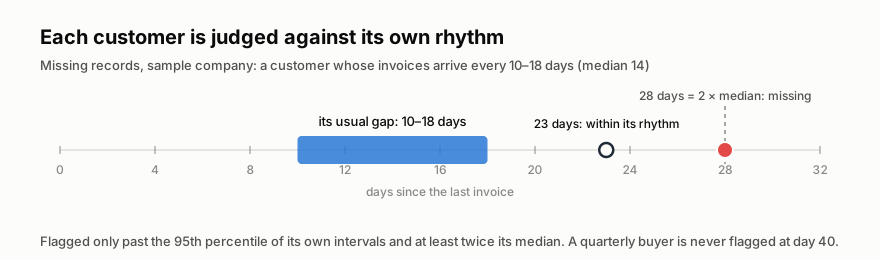
| 8 | Missing records | Customers or suppliers still marked active who went quiet | Each entity judged against its own rhythm (log-normal intervals): a gap beyond the 95th percentile of its own intervals and at least twice its median |
| 9 | Process artefact | Values piling up just under limits and round numbers | A density-discontinuity test (in the spirit of McCrary) at thresholds and round numbers |
| 10 | Cross-source contradiction | The same fact disagreeing across two systems | Reconciliation on shared keys, period by period, against a tolerance and the materiality floor |
| 11 | Bimodal average | An average sitting between two different groups | Hartigan's dip test, then a two-component Gaussian mixture by EM, selected by BIC |
Three details matter more than the list.
Each entity is its own baseline. Missing records does not ask whether a customer is "late" by a company-wide rule. A customer that invoices every 10–18 days (median 14) is within its rhythm at 23 days and missing at 28. A distributor that orders quarterly is never flagged at day 40.
What a detector cannot know, it says. When a fact is measured but its cause cannot be established from connected data, the finding is graded Not determinable. It lists the possible reasons, which of them the engine ruled out with checks it could run (for example, "billing moved to another entity" is ruled out when no new customer shares the same tax identifier), and what would settle the rest.
Known patterns are inputs, not excuses. Diwali week, a plant shutdown, a quarter-end push and a customer's agreed pause are Business Model records. Only a confirmed pattern suppresses; a monthly total is covered by a one-week window only when removing that week's excess brings the month back inside its band. Suppressed results are counted and listed, never hidden.
06From tests to findings: chance, materiality, grade, rank
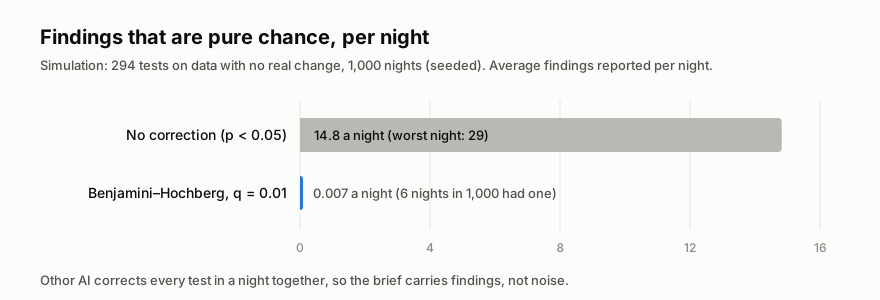
6.1 Multiple testing. A system that tests everything must pay for it. On the sample company, one night performs 294 hypothesis tests. At a conventional 5% threshold, roughly fifteen would look significant by chance alone, every night, forever. Every p-value in a run is therefore corrected together with the Benjamini–Hochberg procedure at q = 0.01, which controls the expected proportion of false discoveries among the results reported. This single decision is what makes exhaustive testing usable: the reader sees fewer, better findings, not more noise.
6.2 Materiality. A statistically real change can be commercially irrelevant. Each detector computes the money at stake with its arithmetic shown (lost revenue at a 12-month average, a price × volume delta, twelve months at an excess per month). Results below a floor the owner sets (by default ₹5 lakh, or $5,000) are recorded as "below materiality" and do not reach the brief. A pile-up under an approval limit with no money at stake is real, and stays in the record, but it does not interrupt the owner's morning.
6.3 Grades. Intelligence analysis distinguishes what is known from what is judged, and says how confident the judgement is. Othor AI does the same on every finding:
- Measured: a computed fact (a value, a share, a gap, a step). No inference about cause.
- Assessed · High / Medium: a claim that rests on a statistical test or an attribution. High requires q < 0.001 and an effect above the detector's strong threshold; Medium passes the FDR correction.
- Not determinable: the fact is measured, but the explanation the owner needs cannot be determined from connected data. The finding says so, and says what would settle it.
- Needs confirmation: two systems disagree; a named person must say which is right.
A title may not state a cause for an item that its decomposition explains less than 70%; it must say what was measured instead. This is the discipline of estimative language applied to a business brief: never claim more certainty than the evidence supports.
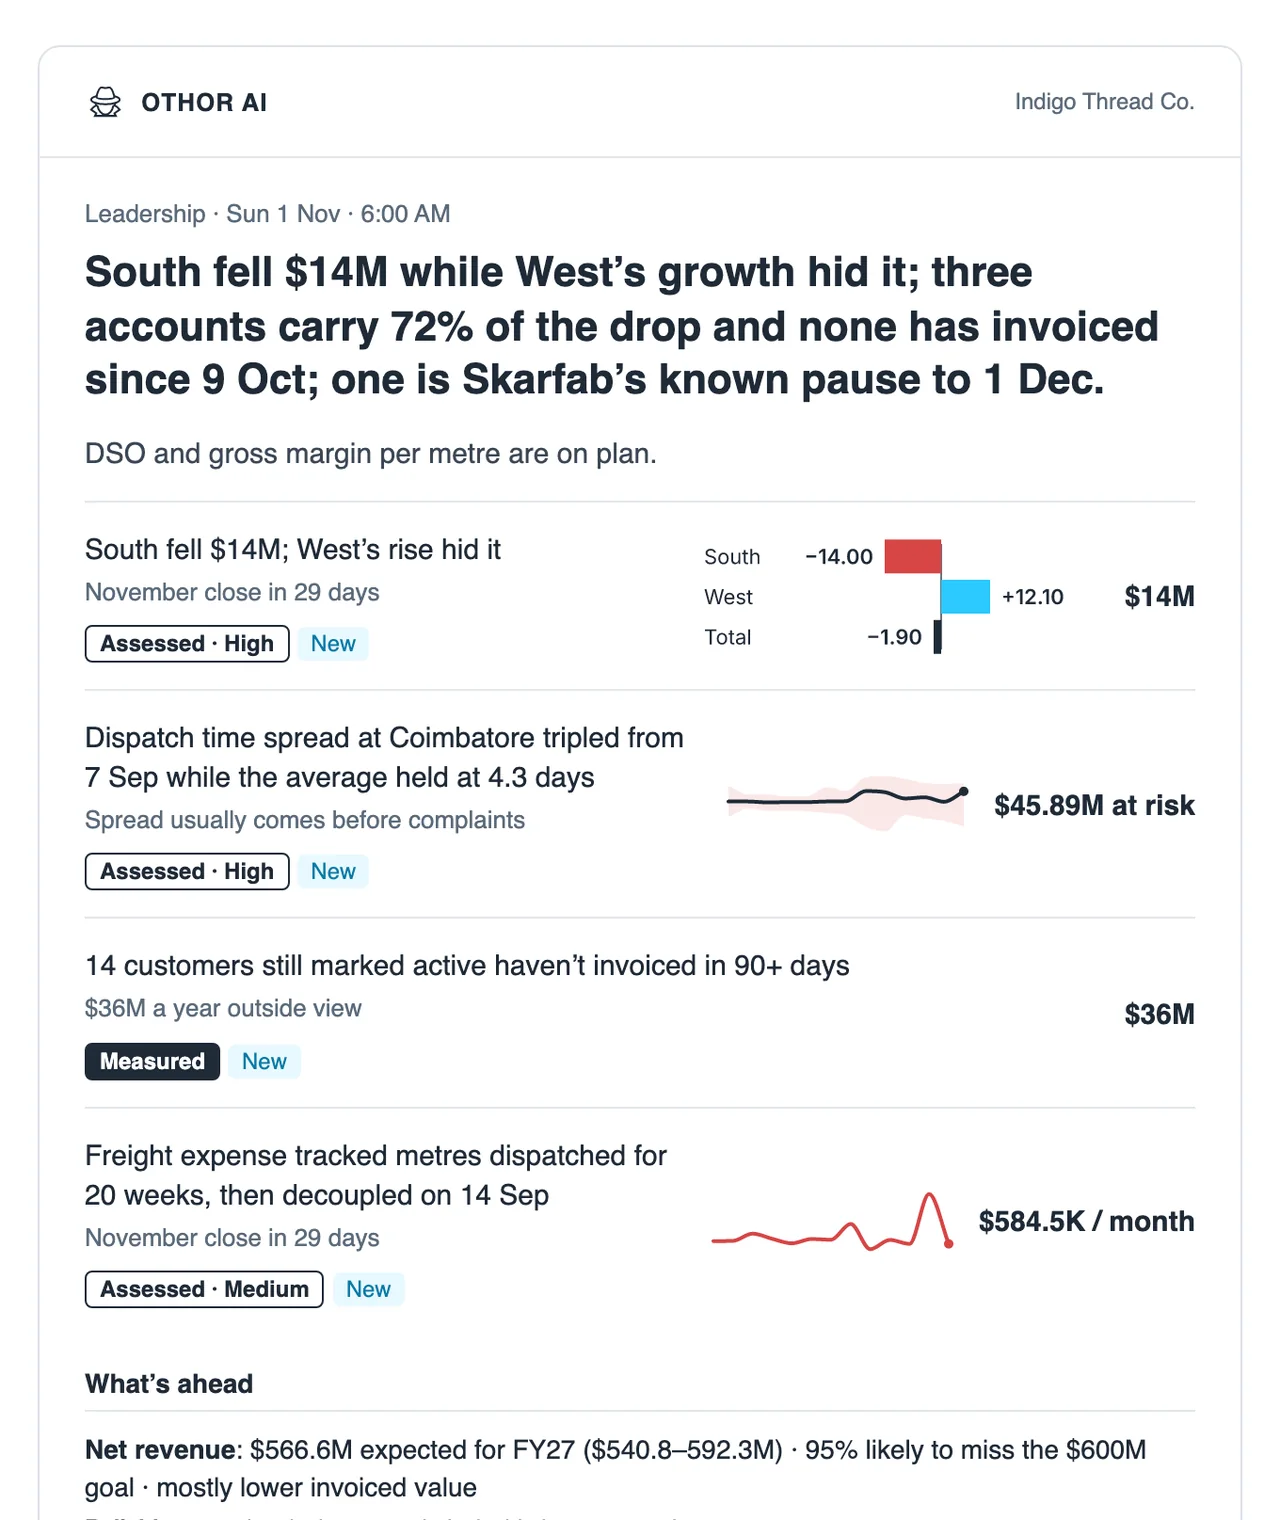
6.4 Ranking. Score = money at stake × urgency × grade weight, in one function. Urgency comes from the consequence date (within 30 days, within 90, later). Ties within 10% break by grade, then the earlier consequence, then the larger sum. An item in yesterday's brief keeps its rank unless its score moves by more than 10%, so the brief does not churn. A brief holds at most four items; each ends with one question for one named person. On a night when nothing passes, the brief says so: nothing needs you today.
07Forecasting with a track record
Forecasts in a brief must be honest about their own reliability.
For each headline series, candidate exponential-smoothing models (statsmodels ETSModel: no trend, additive, damped; seasonal variants only with two full cycles of history) are scored in a rolling-origin backtest over the last 12 complete periods. A candidate must beat a plain baseline (seasonal-naive with a full cycle, otherwise naive) by 5%, or the baseline is used. Periods covered by confirmed known patterns are masked in every fit and excluded from scoring.
Bands are P10/P50/P90. Their width comes from the larger of the backtest's one-step error and the model's own, then calibrated: widened by the smallest factor that would have covered at least 80% of the backtest's actuals. The engine abstains rather than guess when history is short (under eight weeks), a source is stale, the band would be too wide to be useful, or a metric's definition has just changed.
Every forecast is stored before the period it forecasts begins. The forecast of record is never refitted after the fact, so a breach is measured against what was said, not what could be said afterwards. Once enough periods complete, each series carries its real track record (how often the actual fell inside the band, and the typical miss), and the brief words its confidence accordingly: Reliable, Fair or Rough.
08Determinism and provenance
8.1 Pinned everything. Dependencies are locked; the base image is pinned by digest; even the CSS toolchain binary is pinned by SHA-256. Randomised routines are seeded from sha256(spec hash | run date | series id), never from a run id or the clock. Percentiles are computed by a written-out interpolation rule (Hyndman and Fan's type 7), so results never depend on a library version. Stored values and charts are canonical text: sorted keys, fixed six-decimal strings.
8.2 A hash-chained ledger. Each run is sealed into an append-only ledger:
run_hash = sha256(prev | number | kind | spec | image | input | output)othor replay <run_id> re-executes a sealed run from its stored inputs and must produce the same bytes. CI replays every end-to-end run on every merge and fails if a single byte differs.
8.3 Provenance. Every number, finding, forecast and brief sentence can show its definition, compiled SQL, test, parameters, specification version and run, one click away. A finding's Test tab shows the hypothesis, the decomposition chart, each gate with its statistic, and the run.
The practical consequence: when an owner asks "where did this number come from?", the answer is not "the model said so". It is a query, a test and a run that anyone can re-execute.
09The model boundary
Models are useful for language and poor at arithmetic. Othor AI uses them only where language is the work: reading uploaded documents and schema statistics to draft the Business Model and metrics at setup; parsing an owner's one-line correction into a typed record; and, optionally, smoothing a brief's template sentences after the run is sealed.
The boundary is enforced, not promised:
- One gateway. Every prompt is a versioned file with input and output schemas; every call is logged with prompt id, version, token counts, latency, an input hash (cached) and the guard result.
- A numeric guard. Any numeral in model output that is not present in the computed input fails the guard; the sentence is dropped or the template stays. A test feeds the gateway a stub that invents numbers and asserts that the page shows template text.
- Inputs are summaries. A model receives schema names and types, statistics of non-personal columns, computed results and the owner's own text. Never raw rows, never personal columns, never credentials, never another company's data.
- An import contract. The engine and scheduler packages cannot import the AI package at all; an
import-lintercontract fails CI if they try. - The night has no model in it. With no provider configured, every number, test, forecast and ranking is identical; only the prose source line changes.
10Security model
- Read-only, enforced. The connection test inspects the login itself (PostgreSQL role attributes and object privileges; MySQL
SHOW GRANTS) and refuses any role that can write or administer. - Personal data is never read. Personal columns are classified at scan time and excluded from every query, sample and prompt; a query guard rejects SQL that names one; a CI test greps every executed query for flagged columns and must find none.
- Secrets. Source credentials are encrypted with AES-256-GCM under a per-install key. Nothing calls home. Enterprise licences are Ed25519-signed and verified offline.
- Tenancy. A request with one company's session for another company's object returns 404; the test suite asserts it.
- Results, not copies. The data volume holds computed series, evidence aggregates and run snapshots, not mirrors of source tables.
11Evaluation
We evaluate on Indigo Thread Co., a synthetic textile manufacturer generated by the test suite: two plants (one recording dispatch in yards), three product families, export revenue in euros, an ERP in MySQL, a warehouse in PostgreSQL, and two Google Sheets, one with title rows, merged cells, a totals row and mixed date formats. About 205,000 rows and 29 metrics.
11.1 Planted patterns. The generator plants sixteen patterns, each tied to a detector and an expected outcome, for example:
- October net revenue down ₹0.19 Cr while South fell ₹1.40 Cr and West rose ₹1.21 Cr, three accounts carrying 70% of South's fall (net hiding gross);
- receivables over 60 days stepping from about 9% to 14% in mid-August (changepoint);
- a customer that invoiced every seven days for three years, silent since 9 October (missing records, graded Not determinable, with one possible reason ruled out by a check);
- freight decoupling from metres dispatched in September (broken relationship);
- dispatch-time spread widening at one plant while the average holds (rising variance);
- 37 orders dispatched in the warehouse with no invoice in the ERP after 30 days (cross-source contradiction);
- an average order value that is really two populations (bimodal average);
- Diwali week, a plant shutdown and a customer's agreed pause, as known patterns that must be suppressed or must explain, but only where they truly cover.
Alongside them sit ten clean series of similar size and noise that must produce no finding. Each detector also has golden tests: a synthetic series with a planted signal must fire with the expected grade and money within 1%, and its clean twin must not. The full picture of a night (every pattern, detector, grade and money to ₹1 lakh) is a golden file; any change to the generator or the engine that moves it fails CI and must be reviewed.
11.2 Cost and time. Measured on the sample company on 13 Nov 2026 (AWS t3a.large, Mumbai):
| Model cost | Wall time | |
|---|---|---|
| Setup: the model drafts the business model and metrics | about $0.61 in tokens, once | one afternoon of owner review |
| Nightly run: 294 hypothesis tests, 154 SQL queries | 0 model calls | 28 s (47.9 s cold) |
| Replay of that night | 0 model calls | 15.8 s, byte-identical |
| Brief prose (optional) | about 1¢ per brief | pages served in under 140 ms |
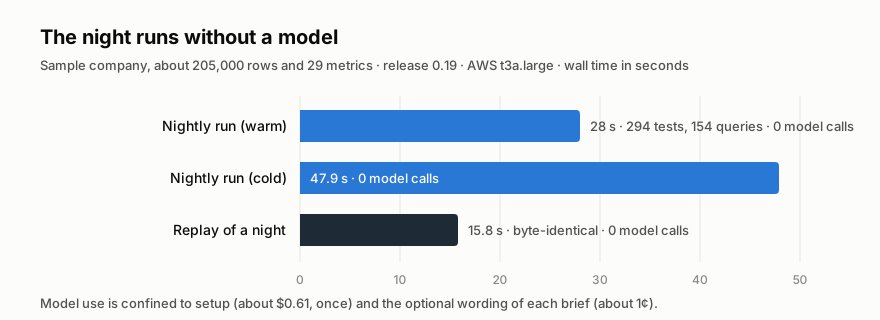
11.3 Guarantees under test. Two consecutive runs on identical inputs produce identical canonical outputs and hashes. A role with INSERT is refused at connection. No executed query names a personal column. No model numeral reaches a page.
12Limitations
We would rather state these than have a reader find them.
- Evaluation is on synthetic data. Planted patterns test that the detectors find what they should and stay quiet where they should. They do not measure how useful the findings are to a real owner over months. That evidence will come from the companies running it, and we will publish it as it arrives.
- Connectors. Today: PostgreSQL, MySQL and Google Sheets, read-only. Other sources are built on demand; until then, a one-off historical report can be produced from an uploaded export.
- Detection, not causation. The engine measures, tests and grades; it does not establish cause. Not determinable is a first-class outcome, and the brief asks a named person rather than guessing.
- FDR is a rate, not a promise. Benjamini–Hochberg controls the expected share of false discoveries; it does not guarantee that every reported finding is real. Grades and materiality gates exist because statistics alone are not enough.
- Short histories. Several detectors need weeks or months of data. Snapshot metrics without history in the source start at the first run (or from back-filled as-of points where a definition allows); forecasts abstain until there is enough.
- Granularity. Detection runs mostly at weekly and monthly grains, with breakdown cardinality capped. Very fine-grained, high-frequency anomaly detection is not the goal.
13Why open source
Systems like this are usually kept behind closed doors. We think that is backwards for software that reads a company's numbers. If it reads your data, you should be able to read every line of it: every detector, every guard, every query it compiles, every prompt it sends.
The open core (Apache-2.0) is the engine, every detector, forecasting, the Morning Brief, Sweep, Summary and the business model, for one company per install. The Enterprise Edition adds Advanced Intelligence and the features larger organisations need, such as several companies on one install, under a licence key verified offline, through the same plug-in entry point the core exposes. Hosted at othor.ai, it starts with a 14-day free trial.
For an IT head, a CTO or a head of data, this changes how a capability like this reaches the company. There is no procurement to start, no call to book and no cost to justify before the first result:
git clone https://github.com/othorai/othor-ai.git && cd othor-ai
cp .env.selfhost.example .env        # OTHOR_DOMAIN, OTHOR_SECRET_KEY, POSTGRES_PASSWORD, OTHOR_SMTP_URL
docker compose -f compose.selfhost.yml up -d
Connect a read-only login in the afternoon (self-hosting guide). The next morning at 06:00, the head of the business reads a brief on their own numbers.
14Conclusion
The question that business intelligence now has to answer is not "can we chart this?" Anything can be charted in seconds. The question is "what should the head of this business know this morning, and how sure are we?"
Othor AI answers it the way intelligence services and signal engineers have answered versions of it for a century: collect continuously, test everything, correct for chance, grade every judgement, connect what moves together, and report briefly, with sources. We have written that discipline down as code, made it deterministic, kept the model at the edge, and opened it for anyone to read.
We call the release Bifrost. In Norse legend, Bifrost is the bridge between worlds. This one connects what a company's data knows to what its head decides.
15About the author
Unni Koroth is the founder of Othor AI. He trained as an electronics and communication engineer and began his career running a telecom network. He co-founded Foradian Technologies and built Fedena, an open-source school ERP that schools in more than 50 countries installed themselves; the Government of Kerala's school management system for over 15,000 schools runs on it. MIT Technology Review India named him one of India's top 35 innovators under 35 (TR35, 2012). He later led business intelligence at Whatfix.
16References
- Y. Benjamini and Y. Hochberg. Controlling the false discovery rate: a practical and powerful approach to multiple testing. Journal of the Royal Statistical Society, Series B, 57(1), 1995.
- R. Killick, P. Fearnhead and I. A. Eckley. Optimal detection of changepoints with a linear computational cost. Journal of the American Statistical Association, 107(500), 2012.
- J. A. Hartigan and P. M. Hartigan. The dip test of unimodality. The Annals of Statistics, 13(1), 1985.
- J. McCrary. Manipulation of the running variable in the regression discontinuity design: a density test. Journal of Econometrics, 142(2), 2008.
- G. C. Chow. Tests of equality between sets of coefficients in two linear regressions. Econometrica, 28(3), 1960.
- R. J. Hyndman, A. B. Koehler, J. K. Ord and R. D. Snyder. Forecasting with Exponential Smoothing: The State Space Approach. Springer, 2008.
- R. J. Hyndman and Y. Fan. Sample quantiles in statistical packages. The American Statistician, 50(4), 1996.
- S. Kent. Words of estimative probability. Studies in Intelligence, 8(4), 1964.
- R. J. Heuer Jr. Psychology of Intelligence Analysis. Center for the Study of Intelligence, CIA, 1999.
- C. E. Shannon. A mathematical theory of communication. Bell System Technical Journal, 27, 1948.